01 / Context
The research question
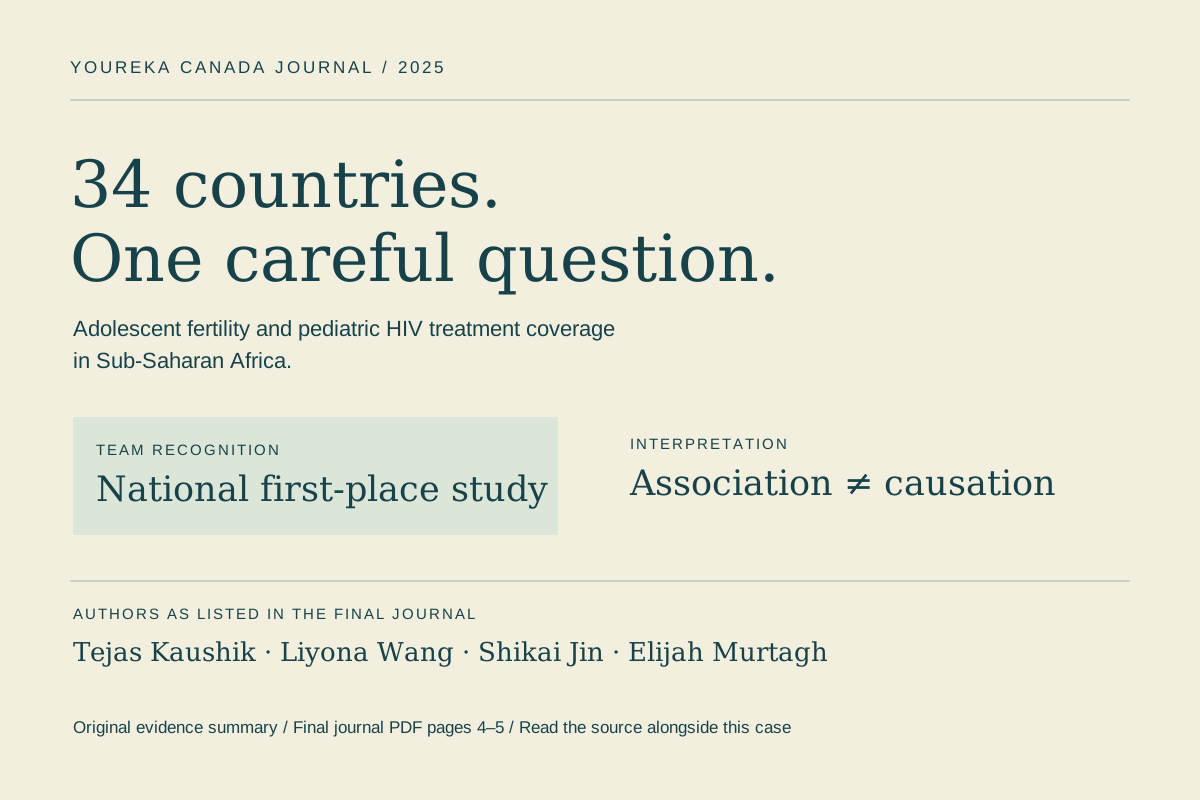
Our team asked whether adolescent fertility rates were associated with pediatric antiretroviral treatment coverage across Sub-Saharan Africa. We paired country-level indicators for 34 countries to examine that relationship.
02 / Scope
My part in the work.
- Handled much of the paper’s writing, data analysis and coordination.
- Coded graphs in R while learning how to use it for the research.
- Helped lead revisions to our hypotheses when the initial tests did not support them.
Team & project context
The paper and first-place recognition belong to all four of us: Liyona Wang, Shikai Jin, Elijah Murtagh and me. An AI tool helped me research many sources, and AI also helped me learn R.
03 / Research interpretation / team study
Keep the claim at the level of the data.
The paper reports a weak negative association: r = −0.3464. Higher adolescent fertility was associated with lower pediatric treatment coverage in this sample.
A country-level correlation can't tell us why any one child gets treatment. We used aggregated estimates, excluded countries with missing data, and compared observations from different years. Those choices limit what we can conclude. The result shows an association; it doesn't establish a cause.
Inspect the source04 / Outcome & limits
Learning R while doing the research
Learning R and getting the graphs to work was hard. My code broke and didn't work for a long time. AI helped me get it working, and I was surprised by how well it was able to teach me.
Our first hypotheses didn't hold up when we tested them, so we changed them. That was a team effort, but I helped lead a lot of it.
A result with limits
The study compares 2022 treatment coverage with fertility observations from 2016 to 2022.
Our study was published in the 2025 Youreka Canada Journal and received national first-place recognition as a team.
- countries in the team study
- 34
- national recognition for the team
- 1st
- Youreka Canada Journal
- 2025
I'd tackle research differently next time. I did a lot of the work myself, and I'd learn how to delegate tasks properly.
05 / Follow the evidence
Sources & context.
The final journal identifies the four authors and first-place recognition on PDF page 4; the 34-country sample is described on page 5. My account of the writing, analysis, R work and AI assistance was added on 12 October 2026; the journal does not establish the division of work.
- 2025 Youreka Canada Journal
Authors and recognition: PDF page 4. Sample: page 5. Correlation: page 6. Figure: page 12.
- Youreka research archive
The organization's journal archive.