01 / Context
Make a spreadsheet easier to inspect
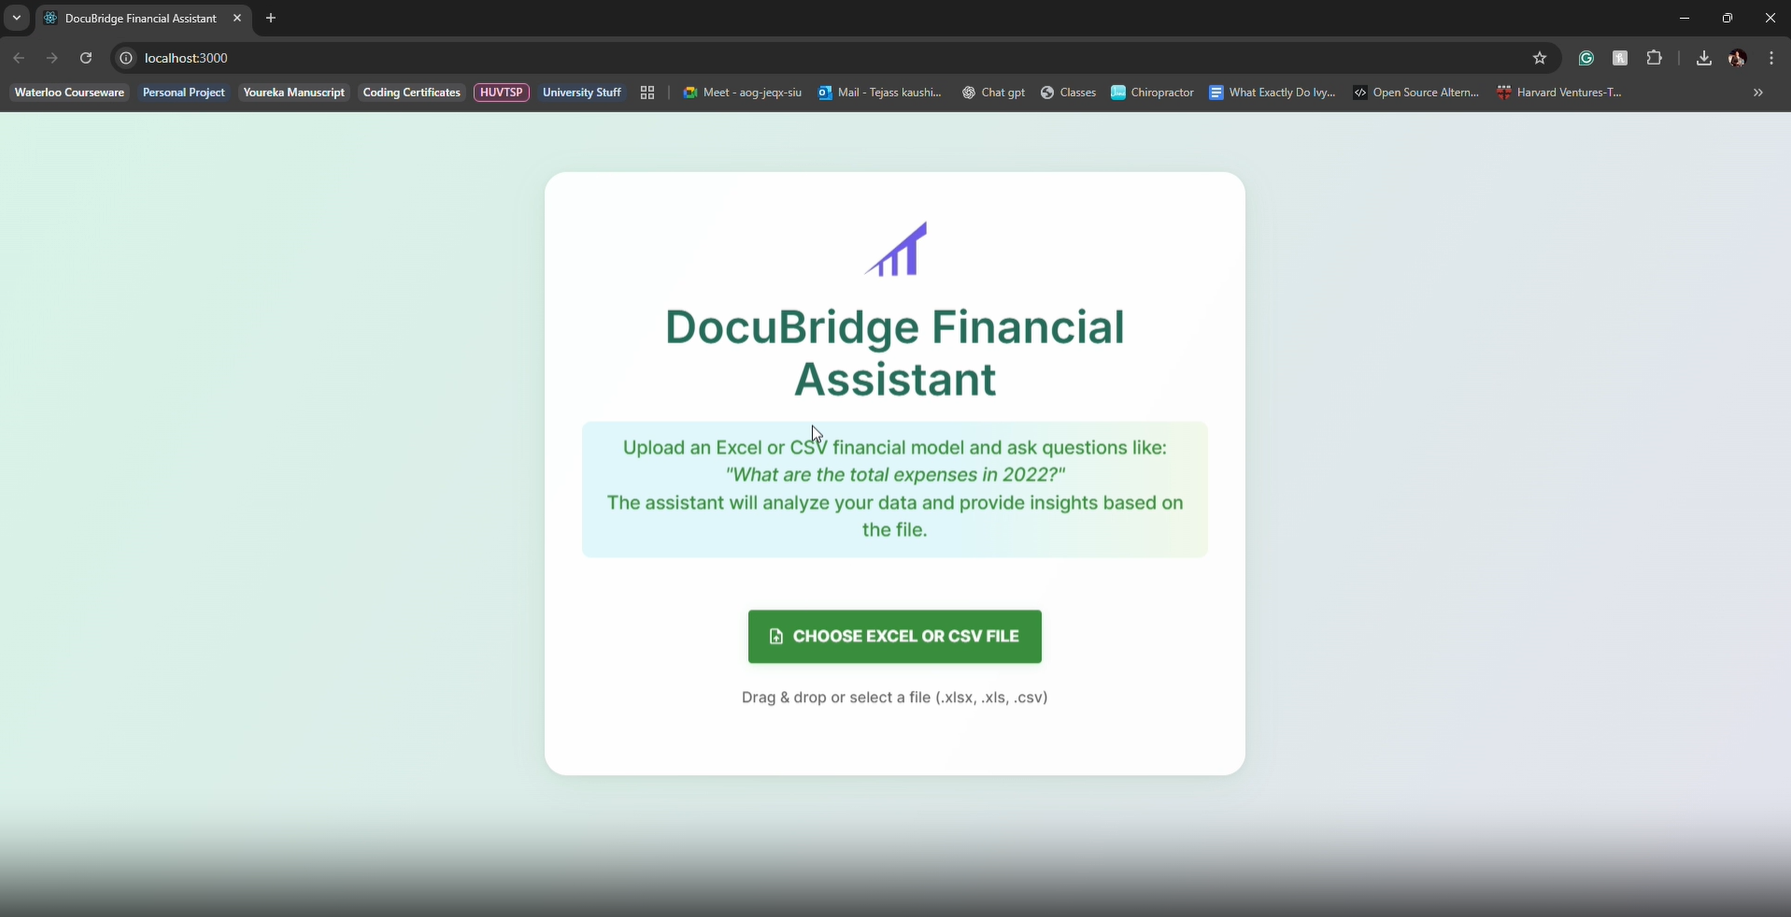
The prototype accepts Excel and CSV uploads, then provides exploratory summaries, trends, ratios, anomalies, forecasts and charts. A question-and-answer layer uses the uploaded dataset as context.
Python, Flask and Pandas handle the data paths. React and TypeScript present the interface, with Plotly charts and an OpenRouter connection for natural-language questions.
02 / Scope
My part in the work.
- Developed the spreadsheet-analysis prototype during my internship.
- Connected the data analysis and generated questions to an interface you can inspect.
Team & project context
This was an internship prototype. The public repository shows the implemented paths, not production adoption, financial accuracy or who wrote every line.
03 / Inspectable implementation choice
Select the sheet before asking the question.
The upload path lists Excel worksheets and records a selected sheet. The analysis and question paths then load that selected sheet; CSV files take a separate parser path.
The analysis also returns column names, numeric columns, summary statistics and charts alongside the generated answers. You can inspect how the code produces them; this isn't an accuracy benchmark.
Illustrative workbook / no upload or AI call
A worksheet, all the way through.
01 / A spreadsheet
Input · Start with the file.
The upload handler accepts Excel or CSV and returns file and worksheet information. This walkthrough uses an invented workbook; nothing is uploaded.
Inspect this source ↗02 / Deliberate selection
Worksheet · Choose what to analyze.
Excel workbooks can contain several tables. The selected worksheet is saved and used by the analysis and question paths. CSV follows its own parser path.
Inspect this source ↗03 / An inspectable table
Analysis · Expose the structure.
The analyzer produces structured results and charts. Column names and numeric columns remain available to the interface alongside the analysis.
Inspect this source ↗04 / Ask about that table
Questions · Keep the source in scope.
The question endpoint reloads the selected worksheet and passes it into the answer path. The question shown here is illustrative; no model or historical backend is called.
Inspect this source ↗05 / An explicit response
Output · Leave a path to inspection.
The interface can present the returned answer and retrieve charts separately. Source-defined structures are inspectable; they are not evidence of forecast accuracy or customer adoption.
Inspect this source ↗Example only: Revenue contains January 120, February 150, March 140. The prepared answer to “Which month has the highest revenue?” is February, 150 sample units. JavaScript adds worksheet selection; the explanation and source links work without it.
04 / Outcome & limits
Learning the technical skills
Honestly, one problem I ran into was learning the technical skills I needed to actually build something like this.
A prototype with a visible path
You can inspect the upload, worksheet selection, analysis, chart and question endpoints in the public repository.
I built this as a prototype. I don't have evidence of production reliability, accurate forecasts or customer savings, and I don't present it as financial advice.
- input formats in the source
- Excel + CSV
- project stage
- Prototype
05 / Follow the evidence
Sources & context.
Role and period are my account. You can inspect the implementation in the public backend at commit a6c9d2b, checked 29 September 2026.
- Analysis backend · pinned source
Upload and selected-sheet handling; analysis response; question endpoints. Source inspected without executing the historical application.
- Prototype repository
Public project source. Repository marketing claims are not treated as measured outcomes.